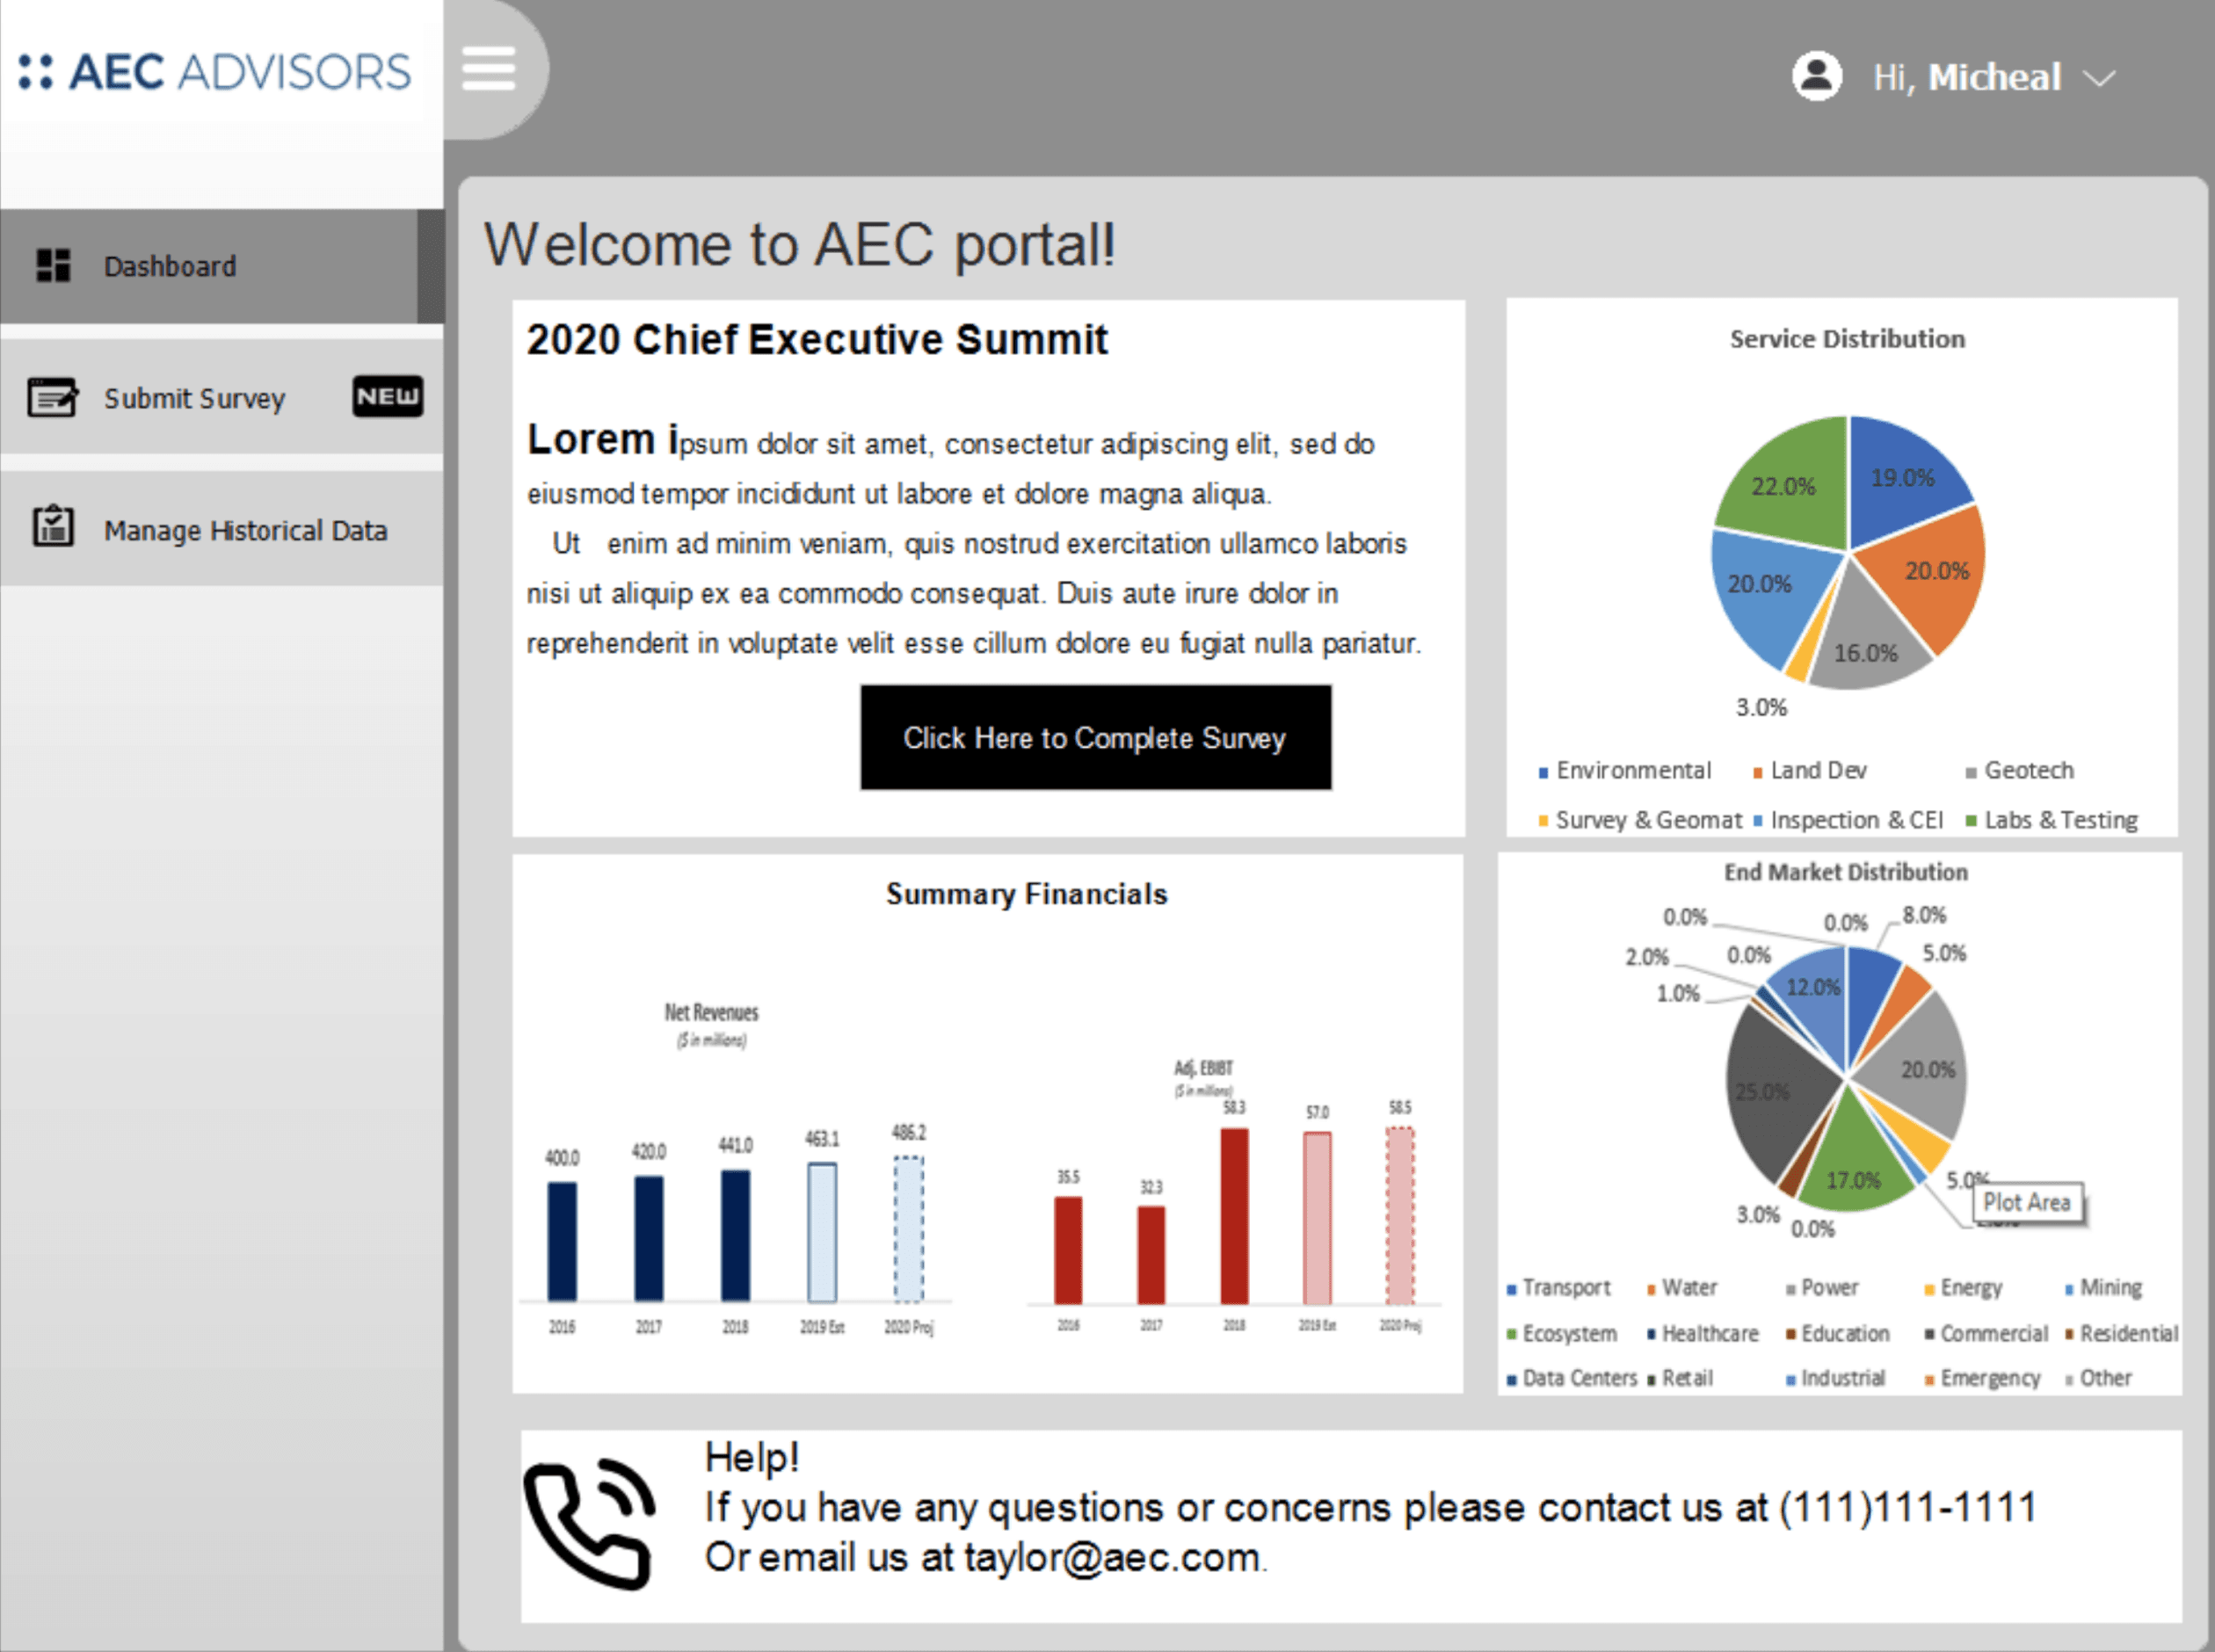
Success Metrics After Launch
Since 2020, customer retention rose from 30% to 90%, transaction value grew from $10B to $16B+, and clients increased from 150 to 500. The client continues to maintain an AMC.
Impact Since Launch (Dec 2020): Key Growth Metrics
Customer Retention Rate
80%
+
200%
Increased from 30% → 90%
Transaction Enterprise Value
$16B+
+
60%
Grew from $10B → $16B+
Total Clients Growth
500+
+
233.33%
Expanded from 150 → 500
Ongoing Engagement
🔹 Client continues to maintain Annual Maintenance Contract (AMC)
More information visit : https://www.aecadvisors.com
Pain Points
During the analysis phase, I identified key pain points in AEC's process. By incorporating these issues into the design with the help of the PMO team, I can make the design much more user-friendly.
Inefficiencies in the Financial Survey Process
The offline process for collecting financial data using the excel sheet is not efficient
No validation as lots of the excel sheet does contains macro calulations
Challenges in Offline Financial Survey Procedures
Lots of error may happen becuase of the offline data entry
Bit difficult for the AEC to folloup to make sure the sheet is filled
300+ Questions in One Survey make it Challenging
300+ question make it big time config to get it filled
Due to the data requirements from various departments, filling out the survey without seeking assistance is challenging.
No Realtime progress checking
Monitoring real-time data added by different departments is very difficult, leading to delays.
This difficulty makes it challenging for AEC admins and client admins to process the data efficiently.
All their clients are familiar with entering data into the sheet.
Introducing a new platform requires clients to learn how it works.
If the survey has already been filled out in the sheet and, users find it challenging and repetitive to enter the data again into the online form.
No collaboration between different departmenet
Since the data is added offline, real-time collaboration is not possible.
This can introduce numerous human errors, leading to inaccurate data and incorrect benchmarks.
Wireframes

Colors & Typography
Name
Blue Sapphire
Primary
Secondary
For Text Contents
Erros, charts, Status tag
For sucess indication, charts, Status tag
Warnings, charts, Status tag
HEX
#0E567D
Name
Light Blue
HEX
#33A7E2
Name
Mid night blue
HEX
#1C2D49
Name
Light red
HEX
#FD5064
Name
Dark green
HEX
#199978
Name
Orange
HEX
#FF8702
Manrope is a google font
Aa
Regular 400
Aa
Medium 500
Aa
Semi-bold 600
Aa
Bold 700
To enhance the modern and sleek appearance of the project, which requires displaying numerous mathematical values related to finance, I selected the Manrope font from Google.
In the project, I followed the brand's color style guide closely. I created specific colors for tags and charts to match the brand’s look and make the application easier to use and more consistent.


Design Process
After conducting usability testing, I began creating mockups that address all the user pain points to ensure the design effectively solves the underlying business challenges.
Project Goal
AEC aims to develop a user-friendly cloud-based web application for more efficient collation of all required financial data, enabling real-time monitoring to reduce frequent follow-ups and minimize human error, ensuring clients have access to up-to-date information and insights.
The Problem
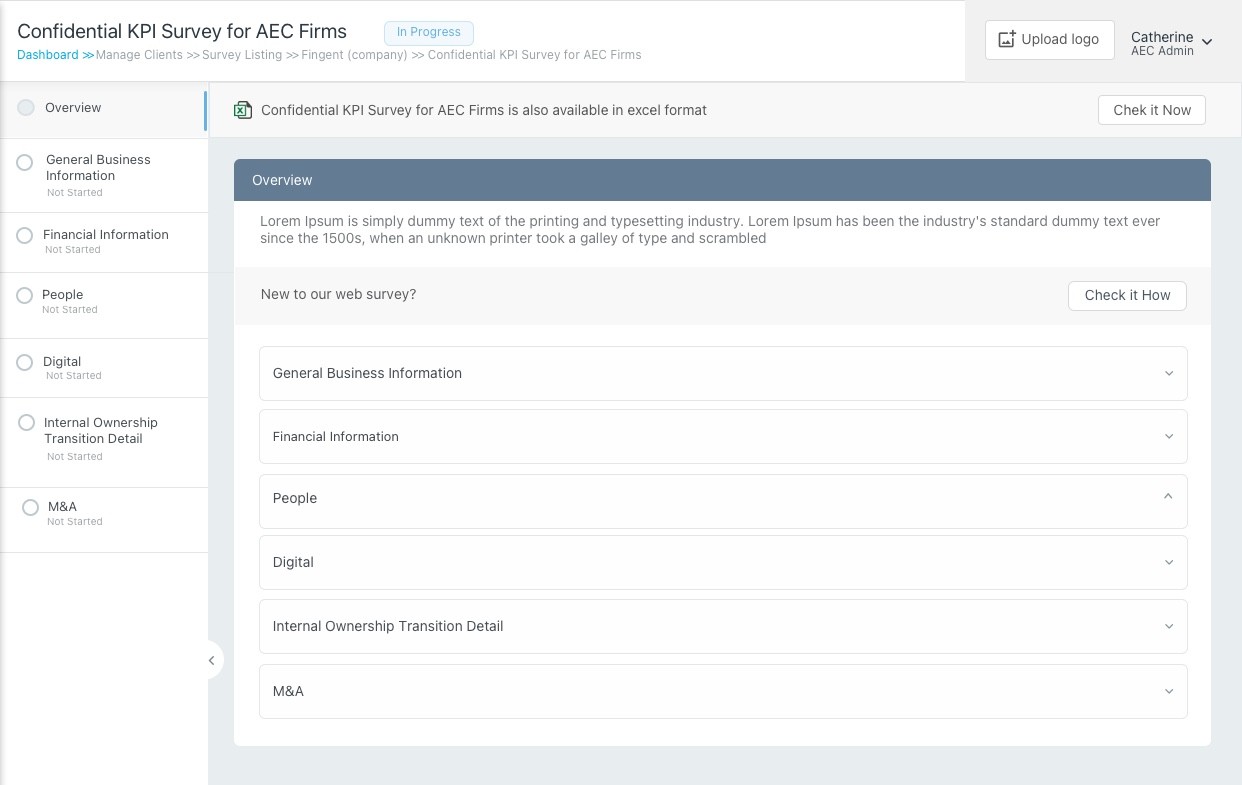
AEC uses an offline Excel sheet to collect required financial data, including general business information, financial information, people, digital, offices, internal ownership transition details, and M&A, to create financial benchmarks and key performance indicators for advising their clients.
Each page contains more than 150 questions to be filled this outdated Excel-based surveys are complex, error-prone, and lack validation tools, leading to frequent follow-ups and offline data entry issues. To improve user engagement, AEC aims to transform their financial data collection from an offline Excel system to an efficient online platform.

About AEC
AEC Advisors, founded in 2018, provides financial consulting for Architecture, Engineering, and Construction firms, specializing in mergers, acquisitions, and corporate finance. They have completed over 107 transactions worth more than $10 billion and focus on industry benchmarking and empathetic advice.
Goals
ACE, a seasoned financial advisory firm, faces issues with their complex, error-prone, offline Excel-based surveys. To enhance user engagement, AEC aims to transform their financial data collection from an offline Excel process to an efficient cloud based online Web platform.
ABOUT
AEC
ADVISORS
Web Application
Transforming AEC Advisors with Quick User Research for Digital Efficiency
AEC Finance Survey Portal
AEC Advisors is a financial consulting firm specializing in advising leaders of Architecture, Engineering, and Construction (AEC) firms. They assist with mergers and acquisitions, corporate finance, and other financial issues, enabling firm leaders to focus on their core business. Founded in 2018, AEC Advisors has completed over 107 transactions valued at more than $10 billion. The firm is dedicated to industry benchmarking and providing authentic, empathetic advice to their clients.

Finder
File
Edit
View
Go
Window
Help
Mon Jun 22
9:41 AM


My responsibilities
My Role as
SENIOR
UI/UX DESIGNER
Feb - May 2020
User research, Wireframing, Visual Designing, Usability testing,
Conducted comprehensive User research to understand the specific needs and pain points of end users
Collaborated closely with clients, project managers, development, and QA teams to gather and synthesize feedback.
Converted wireframes into high-fidelity mockups from the PMO team, enhancing usability by adding features that help End users complete surveys as quickly as possible.
Supported the development team in translating mockups into live code, ensuring design integrity and usability throughout the implementation process.
Continuously iterated on designs based on usability testing and feedback to ensure optimal user satisfaction.


Financial and Institutional Entities
Investors and Financial Institutions
Government and Regulatory Bodies
Industry Consultants and Advisors
Financial officers and analysts
Financial and Institutional Entities
Investors and Financial Institutions
Government and Regulatory Bodies
Government and Regulatory Bodies
AEC Industry Stakeholders
Leadership and executive teams
Business development professionals
Financial officers and analysts
Project managers
Usability Study
FINDING
By conducting the usability testing by the comparing the pain points I find several areas to improve the usability
1
Since the application is new to all AEC customers, an Onboarding process for the survey will greatly assist in getting started with data entry.
2
An option to Upload existing Excel files into the system would be useful for users who have already filled out the survey and need to make only a few changes to their data.
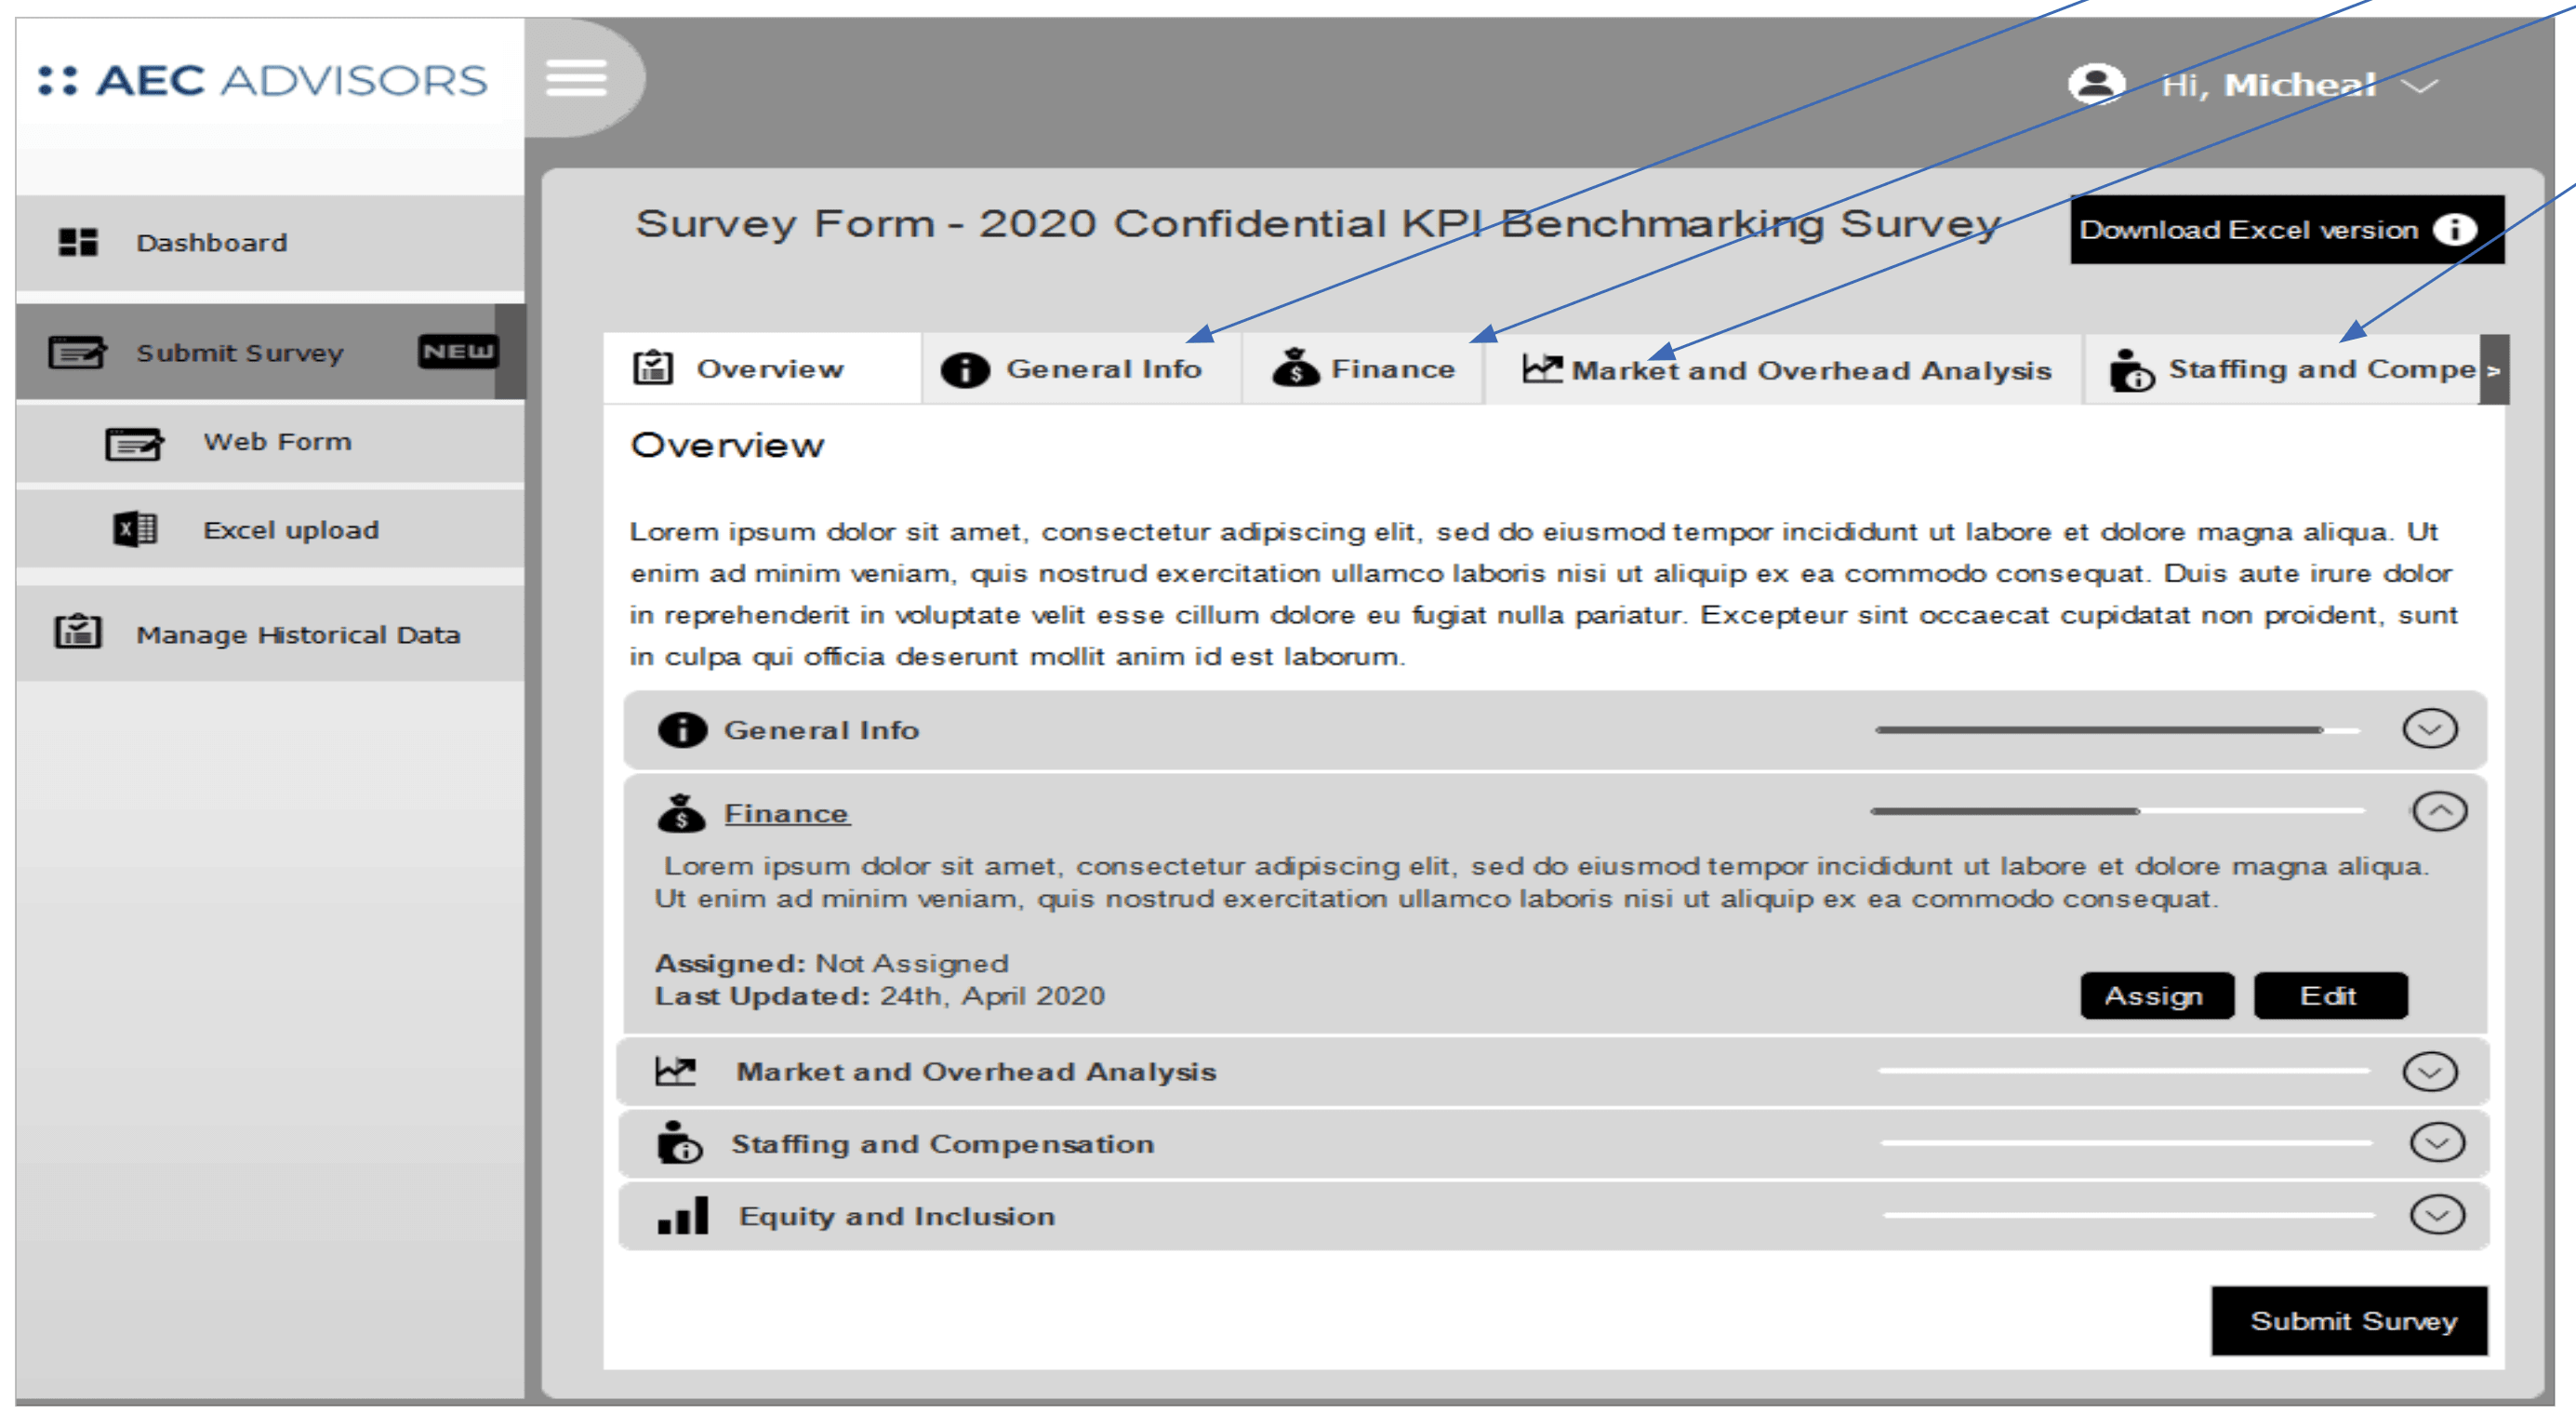
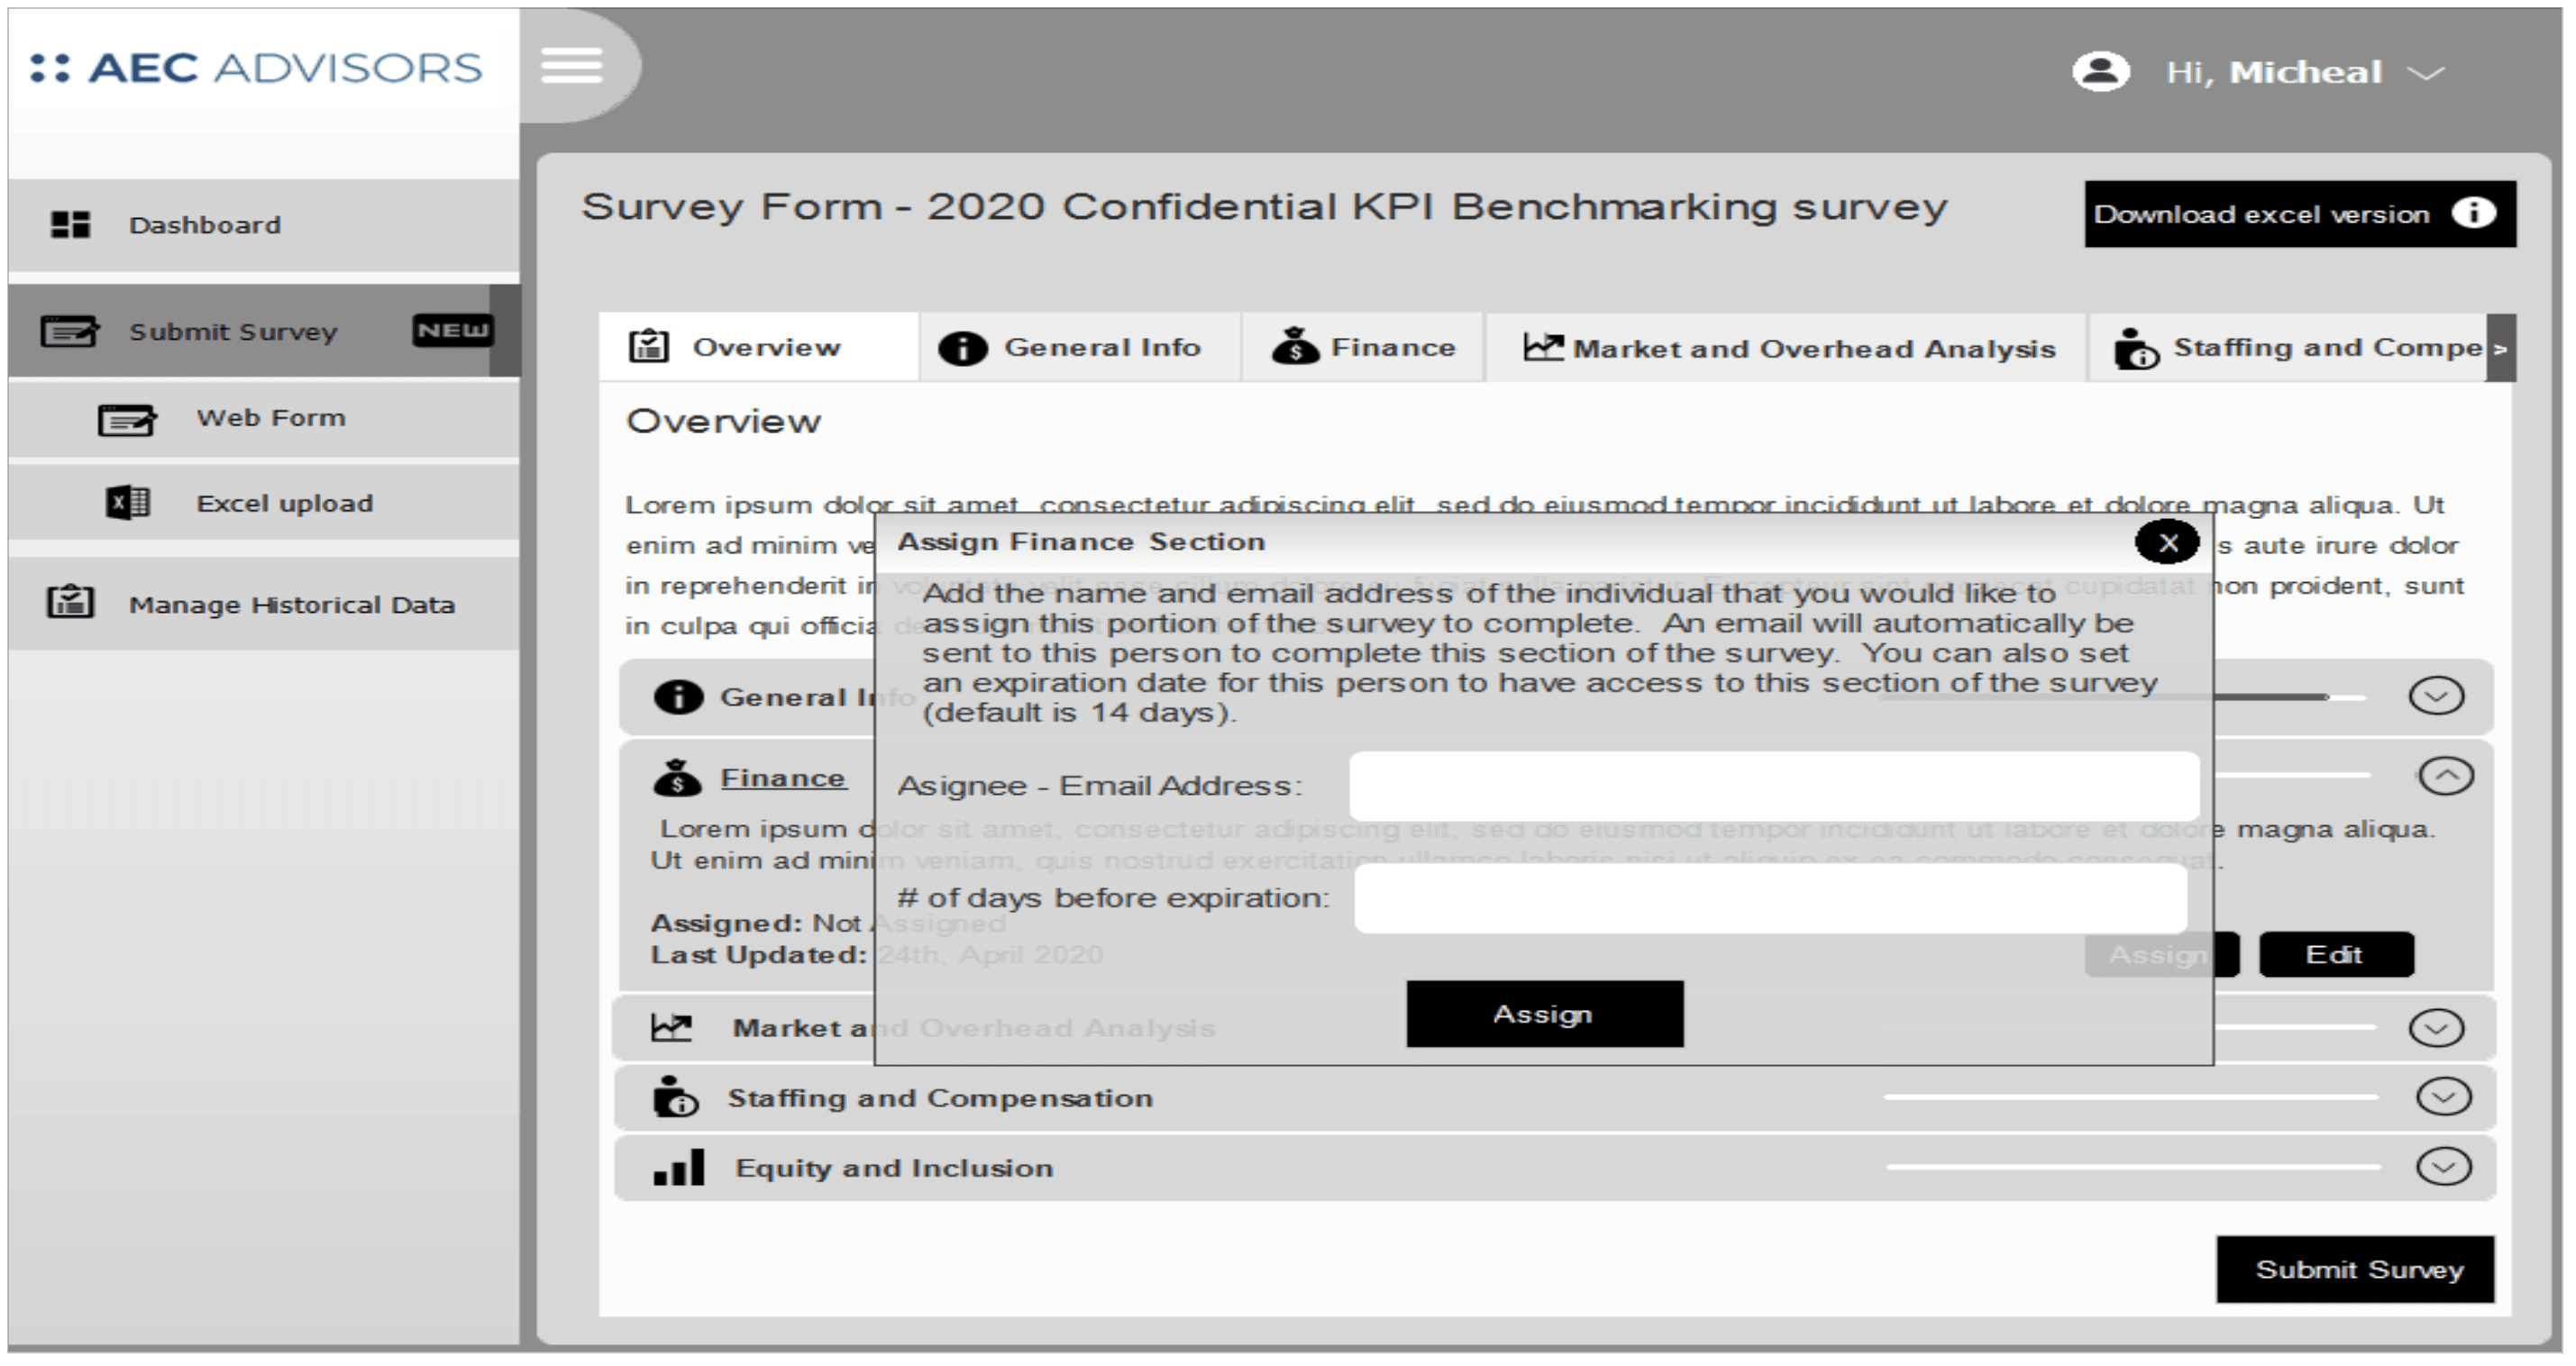
3
An option to Assign different segments of the survey to various departments would greatly improve overall usability and collaboration.
4
Real-time Error validation will improve usability by preventing errors during Excel uploads or data entry via built-in forms.
5
Providing an option to choose between a Web form and Excel upload would help first-time users gradually adapt to the new web form, which is the core of the application.
6
Making the Web form experience as like as the excel will gratily improve the usability
TARGET
AUDIENCE
Architecture, Engineering, and Construction (AEC) Firms
RESEARCH
To gain insights into the pain points faced by current users.
In the project analysis phase, with the help of the PMO team, I conducted a quick user research via email to understand the pain points that need to be addressed in the final mockup to improve the usability of the application across different users.
Usability
Ensure the app is easy to Get started with, especially since it is new platforms to Users.
Interview Questions

Can you describe what is the current issues you re facing while adding datas in to the excel sheets
What challenges do you face when filling out the Excel sheet?
How do you coordinate with other departments to gather the necessary information?
How often do you update the Excel sheet?

I receive the Excel sheet and manually input data from various departments. It's a long process because the sheet has more than 300 questions, including HR and finance-related data. The macros sometimes cause errors, and it takes a lot of time to ensure all information is accurate.
It's very time-consuming and prone to errors, especially with the macro
Coordinating with different departments is challenging and takes a lot of time, as I need to gather information from each one
We update the Excel sheet every quarter, which means the data can be outdated by the time we finish.
What is your current process for adding data from different departments?

I have to gather data from each department separately, usually through emails or meetings, and then manually enter all the information into the Excel sheet. This process is very time-consuming and prone to errors
DESIGN
PROCESS
User research to Mockups
Wireframes
I used the wireframe as my initial reference for the mockup, addressing the pain points to ensure the design solves the business challenges and user issues.
My design process
After completing the analysis phase, the client has pushed to finish the mockup to start the development process, aiming to get the application live as soon as possible by integrating prioritized user feedback and aligning with project goals within a limited timeframe.
Challenges 1
Tight timeline to get the mockup approved to start the development process
Create and deliver a high-fidelity mockup in 7 days, incorporating prioritized user feedback into a provided wireframe, to ensure quick client approval and prompt commencement of development.
Solution
After analyzing user feedback to identify key pain points, I skipped empathy mapping and user personas. Instead, I directly integrated the feedback into the provided wireframe, prioritized essential features, and quickly created a high-fidelity mockup using design systems and rapid prototyping tools. I ensured the mockup addressed critical issues and prepared an interactive presentation for quick client approval, aiming to start development within in one week.
Challenges 2
No time to update the wireframe created during the initial stages of the analysis.
Because of the short timespan, updating the wireframe to include user pain points would take too much time, as the wireframe was created during the initial stages of analysis.
Solution
With the tight deadline, I skipped updating the PMO wireframe and applied user pain points directly to the mockup, using the original wireframe as a guide. To create initial mockups quickly, I started by designing a mood board for the core survey page.
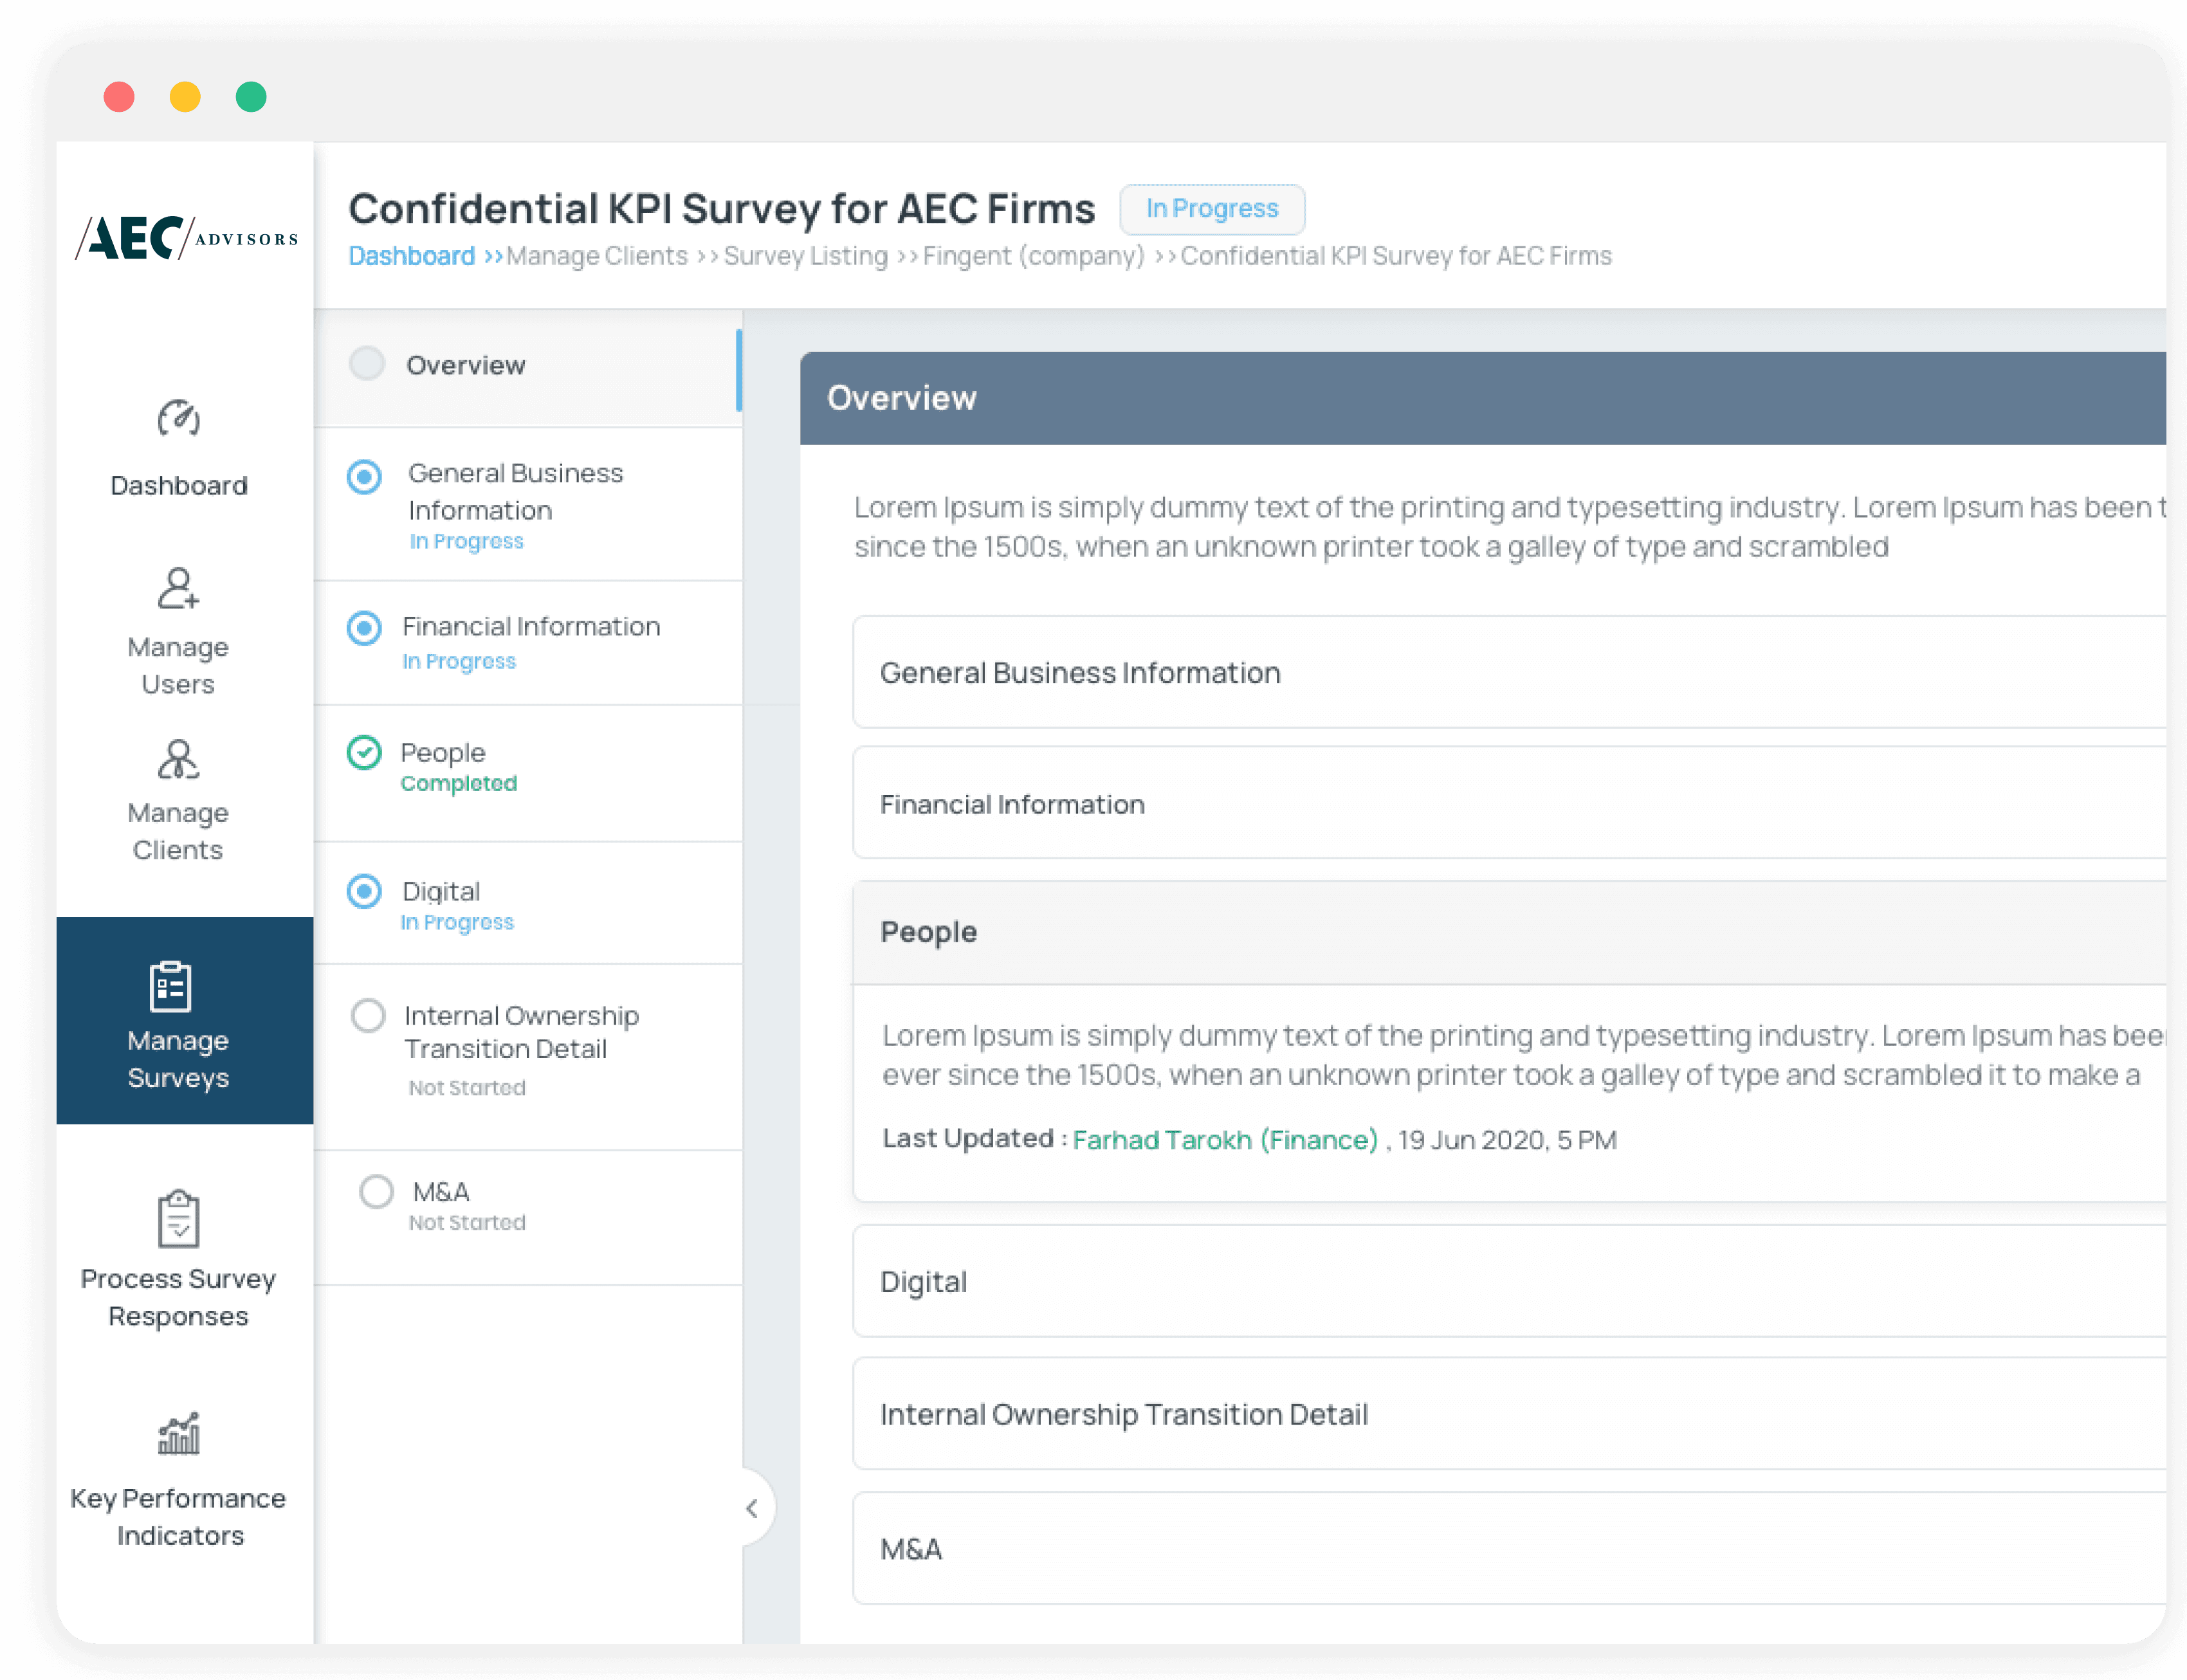
Navigation
Simplified & Organized Navigation
The user journey was mapped out to identify and eliminate unnecessary steps, resulting in a streamlined navigation path.


Get started
Get Started with Finance Survey Faster
As this application is new, I’ve added a "Get Started" section with animated GIFs to ensure first-time users have a smooth, step-by-step guide for entering their financial data.

Import data
Import Data from an Existing Survey Excel Sheet
Offering a choice between a web form and Excel upload allows first-time users to gradually transition to the new web form, which is central to the application.
22px Bold


Upload data
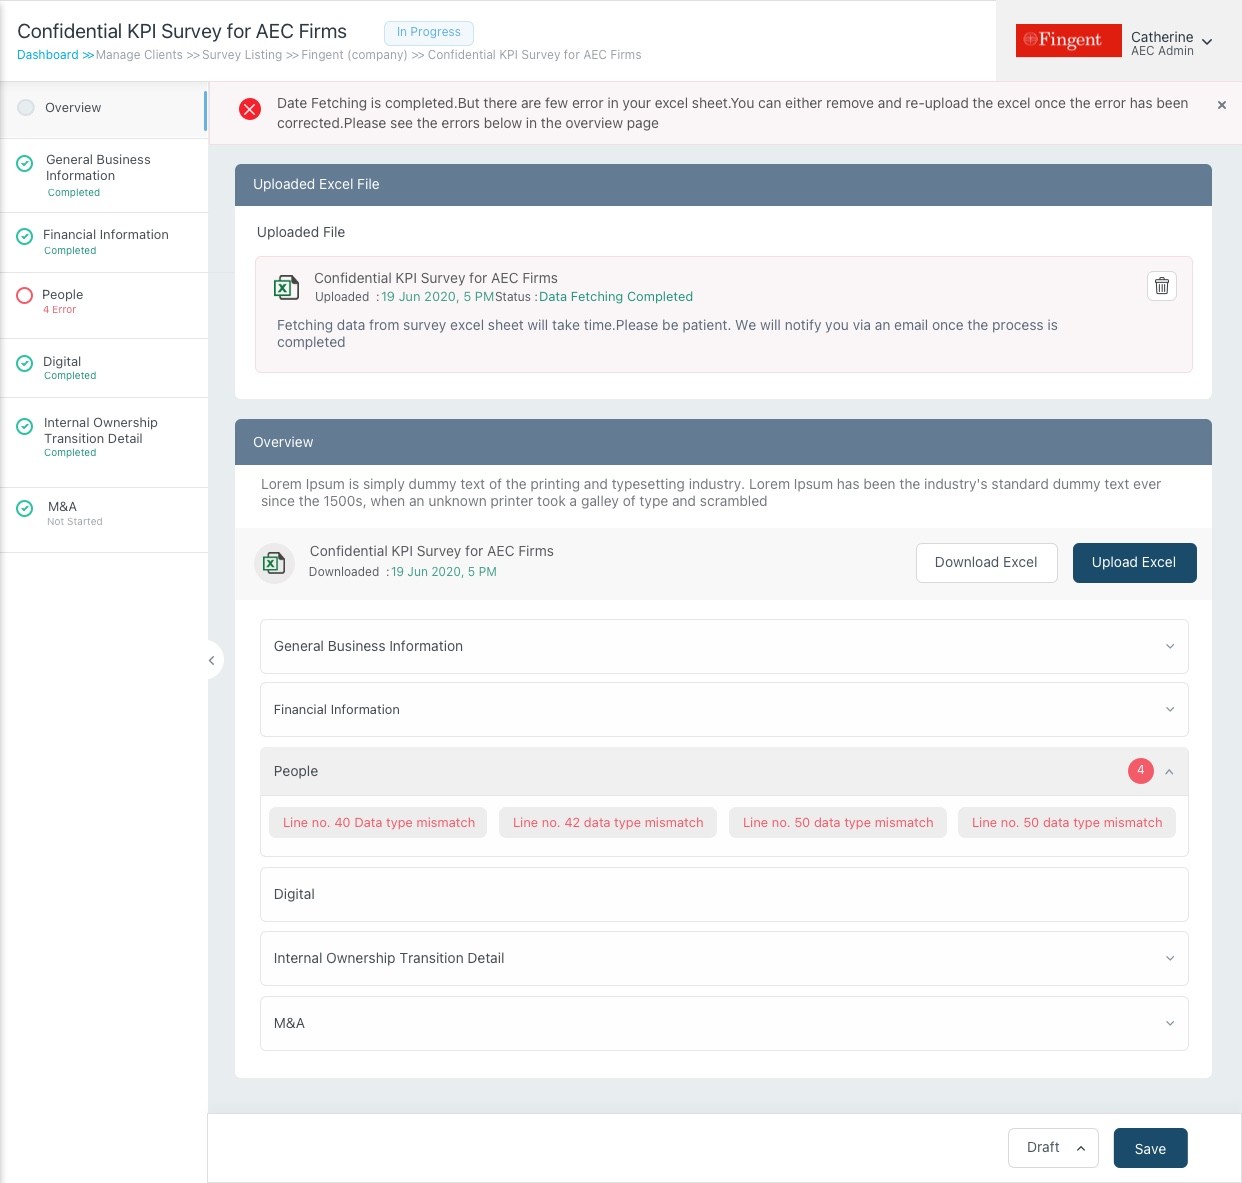
Realtime upload progress for the fetching data from the excel sheet
Given that the Excel sheet contains over 300 questions, fetching all the data can be time-consuming. Providing a real-time progress indicator will help users understand the upload and data retrieval duration more clearly.

Feedbacks
Post-Upload Feedback
Once data is added through the web form or Excel upload, providing feedback is crucial to confirm that the survey is completed successfully and inform the user of the next steps.
22px Bold
Validation
Real-Time Error Notifications
It is crucial to notify users if any incorrect values are entered or mandatory fields are left blank. This ensures that all submitted data is accurate, allowing AEC to provide precise financial advice essential for their business.

Web form
Familiar Excel-Like Web Form Design
This design mimics Excel to help users comfortably transition and gradually adapt to the new web form.
22px Bold

Validation
Design System for Seamless Scalability and Consistency
Despite the tight project timeline, I developed and maintained a design system to support feature consistency and facilitate future scaling.

Web form
Component Library for Design Consistency
I’ve designed a Component Library to ensure design consistency and simplify maintenance with reusable elements.
22px Bold

All Mockups
The AEC web survey portal includes additional modules such as User Management, Campaigns, Reports, and M&A Transaction Data.
Iconography
Material Icon Set
Google Material Icons is a comprehensive set of modern, consistent, and easily customizable icons designed to work seamlessly with the Material Design guidelines. These icons enhance user interfaces by providing clear, intuitive visual cues across various platforms and applications.

22px Bold
